All official European Union website addresses are in the europa.eu domain.
See all EU institutions and bodiesAn official website of the European Union | How do you know?
Environmental information systems
EN
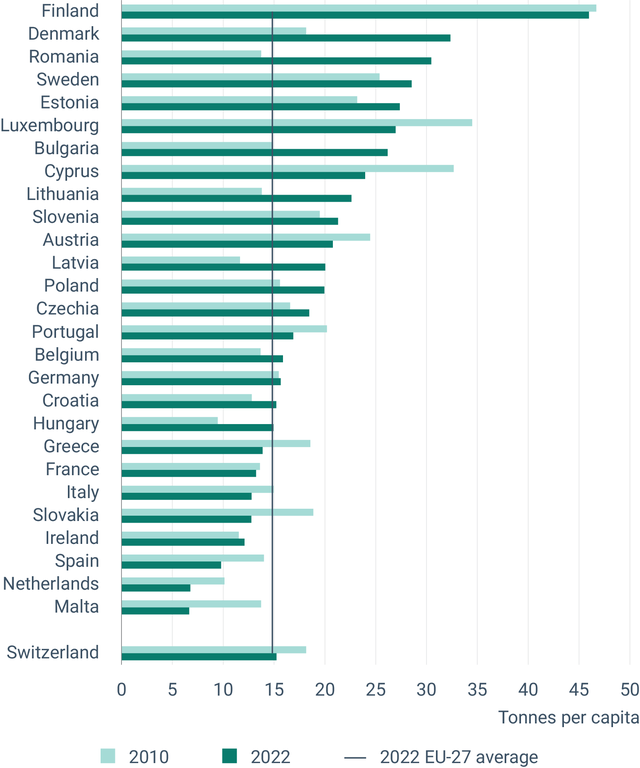
The graph shows the material footprint level for the EU Member States, meaning the sum of materials needed to produce the goods demanded by EU citizens.
Loading