All official European Union website addresses are in the europa.eu domain.
See all EU institutions and bodiesAn official website of the European Union | How do you know?
Environmental information systems
EN
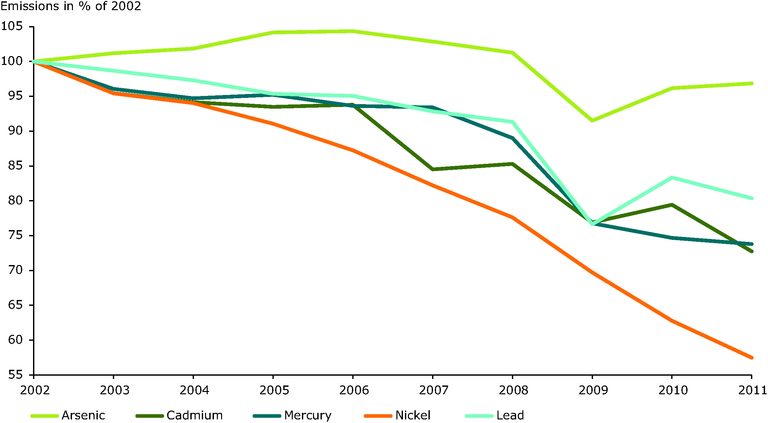
The graph shows the development in As (and
other heavy metals) emissions reported by the
EU Member States between 2002 and 2011 as a
percentage of 2002 emissions.
Loading