All official European Union website addresses are in the europa.eu domain.
See all EU institutions and bodies
An official website of the European Union | How do you know?
Environmental information systems
EN

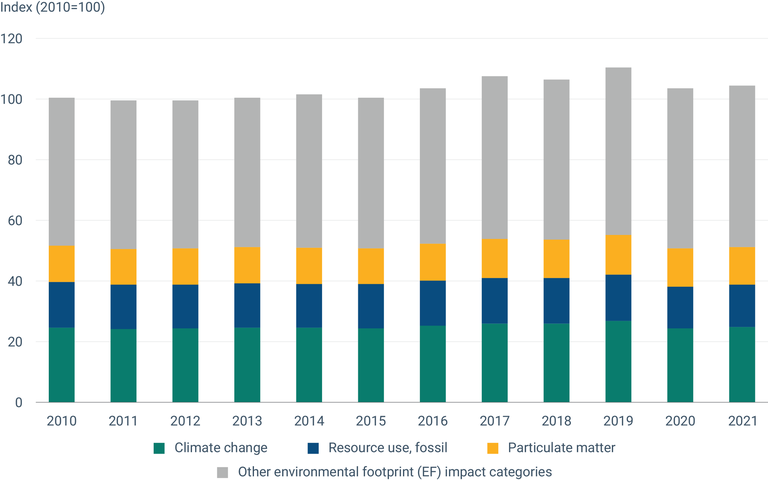
The figure shows the weighted impacts from the entire EU consumption over time, indexed to 2010.
The EU consumption footprint is shown as a single indexed score (2010=100) and is broken down according to the impact categories of the Environmental Footprint (EF) method that make the most significant contribution to the consumption footprint - ‘climate change’, ‘resource use, fossil’ and ‘particulate matter’ - and other EF impact categories.
Loading