All official European Union website addresses are in the europa.eu domain.
See all EU institutions and bodiesDo something for our planet, print this page only if needed. Even a small action can make an enormous difference when millions of people do it!
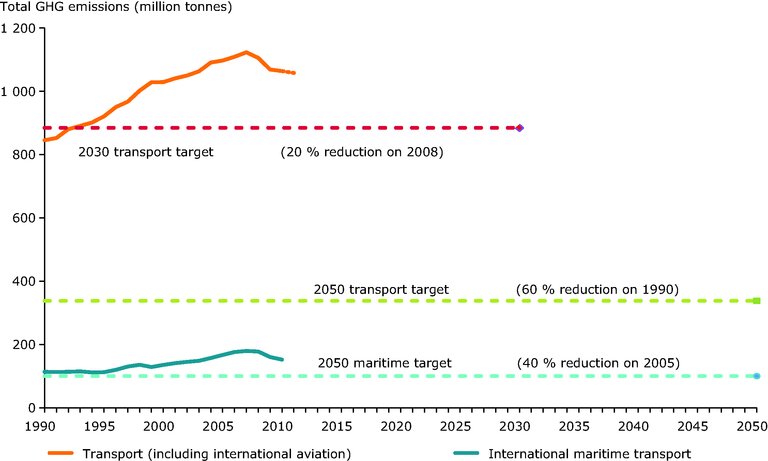
Figure
The figure includes proxy data for 2011, which is an EEA preliminary estimate. It was originally estimated excluding international bunkers. In order to show 2011 data covering the same scope as in previous years, 2010 value of international aviation emissions was added to the 2011 proxy. This corresponds to the basic assumption that international aviation emissions did not change between 2010 and 2011, which would in fact be similar to the trend observed in 2009-2010 (-0.1%). On the figure, the 2010-2011 trends is dashed
For references, please go to https://www.eea.europa.eu/data-and-maps/figures/eu-27-transport-emissions-of-1 or scan the QR code.
PDF generated on 01 Oct 2023, 04:13 AM
Engineered by: EEA Web Team
Software updated on 26 September 2023 08:13 from version 23.8.18
Software version: EEA Plone KGS 23.9.14
Document Actions
Share with others