next
previous
items

Figure

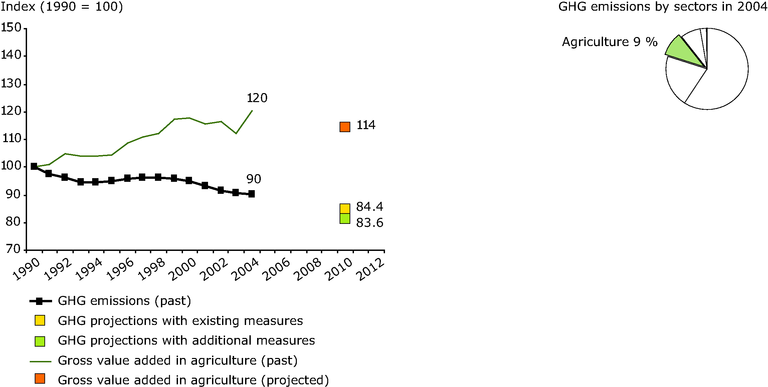
EU-15 past and projected greenhouse gas emissions from agriculture and gross value added

Figure Created 12 Nov 2009 Published 12 Nov 2009 Last modified 29 Nov 2012
1 min read
Left: This graph shows past (1990-2004) and projected (2010) emissions due to agriculture, and compares them with gross value added in agriculture

Download

Metadata

Additional information

Right: This graph represents the share of emissions from agriculture in total GHG emissions in the EU-15, in 2004

Permalinks

Geographic coverage

Topics