Figure
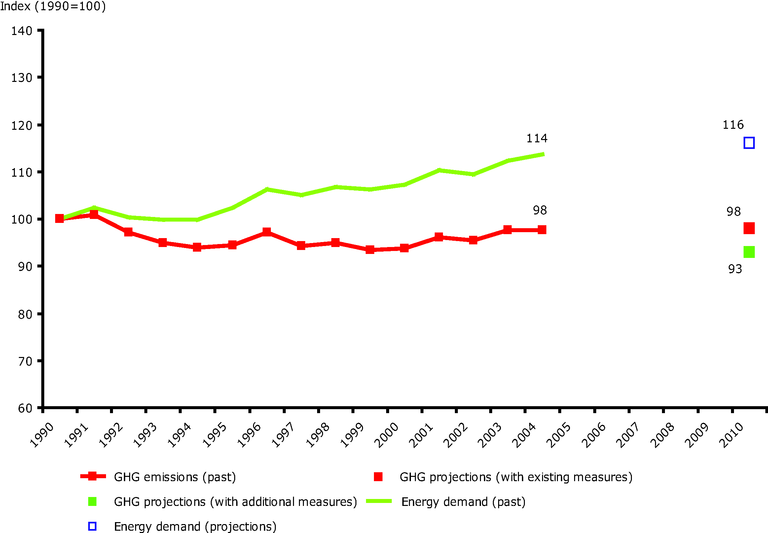
EU-15 greenhouse gas emissions from energy supply and use (excluding transport) compared with energy demand
Additional information
The 2004-2010 percent variation for the EU-14 was applied to Germany to obtain an EU-15 projection for 2010. No additional measures were reported for Denmark, Ireland, Luxembourg, Spain and Sweden. For these countries, the 'with existing measures' projections were used for the calculation of the EU-15 (with additional measures) projections. Past sectoral emissions are complete.
Permalinks
- Permalink to this version
- B8758780-B85D-461A-9C88-F624C54A30AE
- Permalink to latest version
- C0293C9F-F085-4B5D-9613-D737DC66059B
Geographic coverage
For references, please go to https://www.eea.europa.eu/data-and-maps/figures/eu-15-greenhouse-gas-emissions-from-energy-supply-and-use-excluding-transport-compared-with-energy-demand-2 or scan the QR code.
PDF generated on 08 Feb 2023, 07:54 AM
Document Actions
Share with others