All official European Union website addresses are in the europa.eu domain.
See all EU institutions and bodiesAn official website of the European Union | How do you know?
Environmental information systems
EN
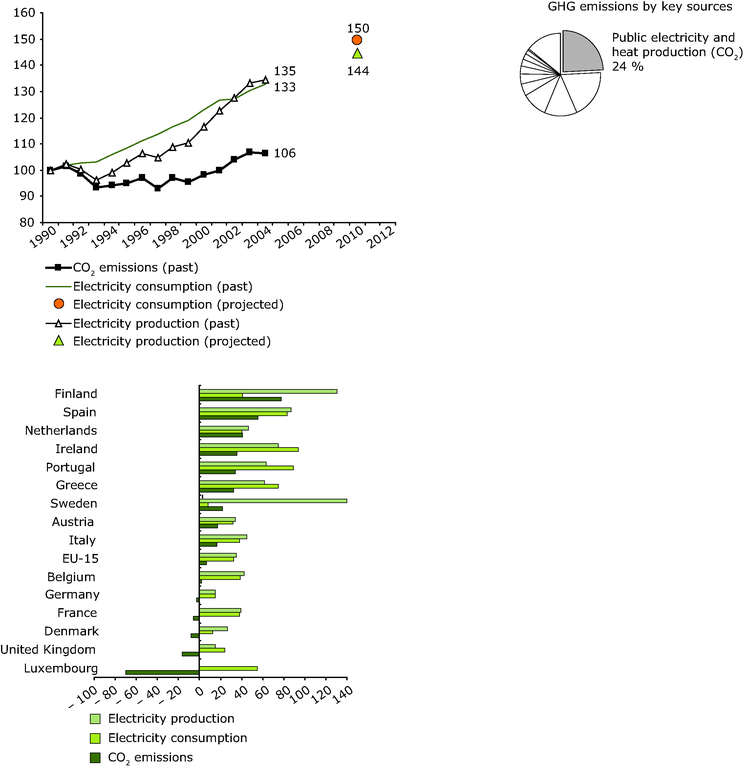
Left: This graph shows past (1990-2004) carbon dioxide emissions due to public electricity and heat production, and compares them with past and projected electricity production in thermal power plants and final electricity consumption
Loading