All official European Union website addresses are in the europa.eu domain.
See all EU institutions and bodiesAn official website of the European Union | How do you know?
Environmental information systems
EN
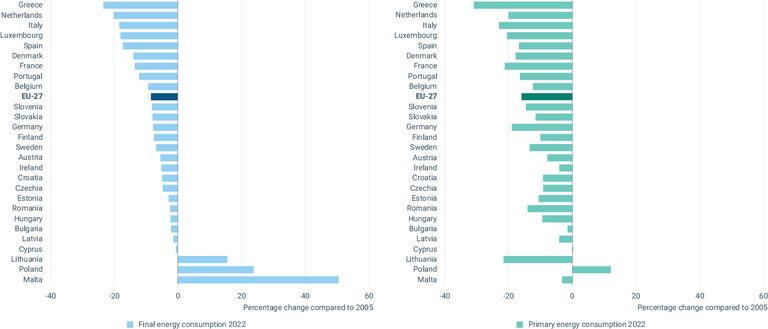
This chart shows the change in energy consumption of EU Member States in 2022 compared to 2005.
Loading