All official European Union website addresses are in the europa.eu domain.
See all EU institutions and bodiesDo something for our planet, print this page only if needed. Even a small action can make an enormous difference when millions of people do it!
Figure
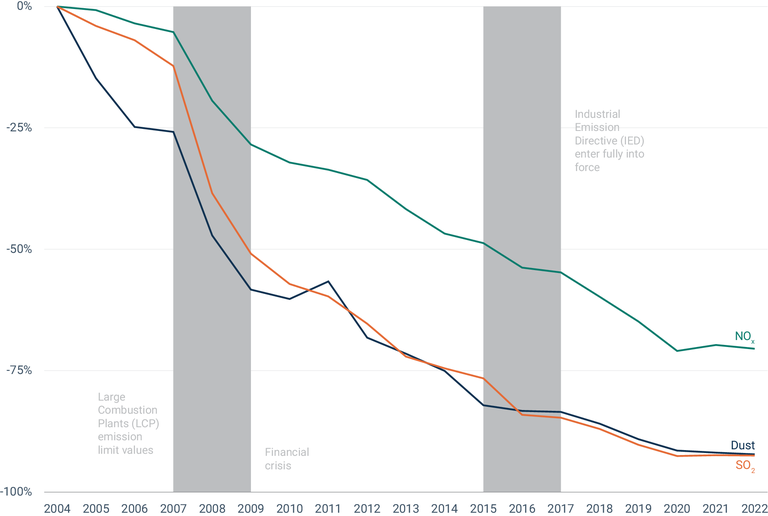
The figure shows the trend of emissions into air of DUST, NOx (Nitrogen Oxides) and SO2 (Sulphur dioxide) from Large Combustion Plants (LCP) in the EU-27. In addition, data for some Member States has been gap-filled as follow:
Czechia: 2020 values used to gap fill 2021-2022
Malta: 2019 values used to gap fill 2020-2022
Slovakia: 2018 values used to gap fill 2019-2022
Bulgaria: 2021 values used to gap fill 2022 due to late reporting
For references, please go to https://www.eea.europa.eu/data-and-maps/figures/emission-reductions-for-dust-nitrogen-3 or scan the QR code.
PDF generated on 19 May 2024, 05:52 AM
Engineered by: EEA Web Team
Software updated on 26 September 2023 08:13 from version 23.8.18
Software version: EEA Plone KGS 23.9.14
Document Actions
Share with others