All official European Union website addresses are in the europa.eu domain.
See all EU institutions and bodiesAn official website of the European Union | How do you know?
Environmental information systems
EN
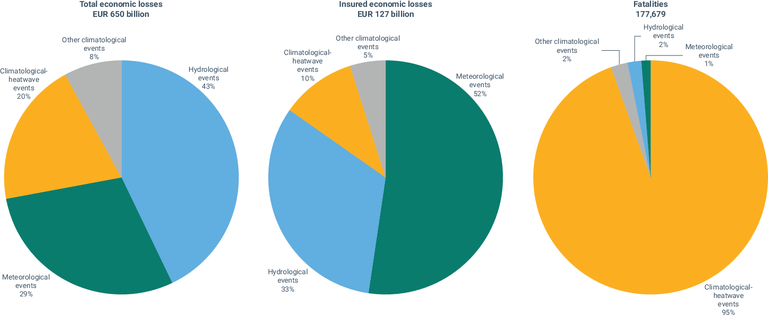
Total economic losses, insured economic losses and fatalities per hazard type.
Hazard types: meteorological hazards, hydrological hazards, climatological hazards (heat waves), climatological hazards (other).
Loading