All official European Union website addresses are in the europa.eu domain.
See all EU institutions and bodiesDo something for our planet, print this page only if needed. Even a small action can make an enormous difference when millions of people do it!
Figure
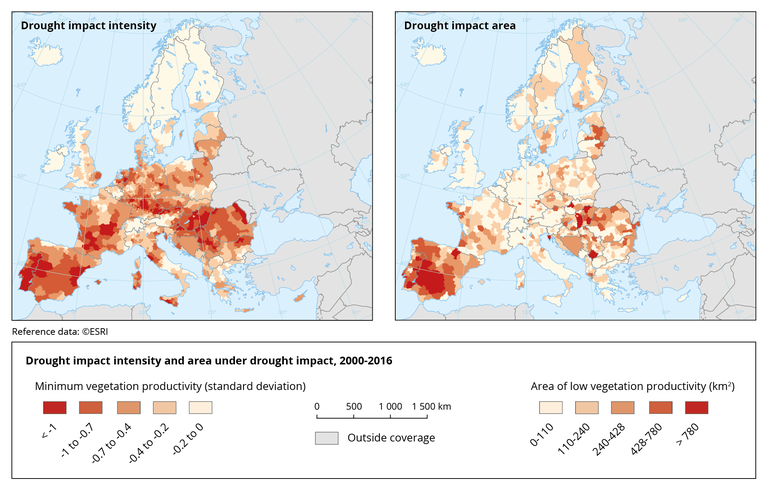
Standardized anomalies of yearly vegetation productivity during 2000-2016 are analyzed in areas with statistically significant drought pressure measured as precipitation shortages and low soil moisture content.
Anomalies are expressed in standard deviations compared to the long term average vegetation productivity conditions for each 500m grid cell in the EEA39 region. Negative vegetation productivity anomalies indicate vegetation productivity conditions that are less than the long term normal condition.
The extent of the impacted area is calculated from the sum of those grid cells where the vegetation productivity anomaly was below -1 standard deviation in the given year.
In order to exclude low vegetation anomaly signals in the time series, only those grid cells were considered in this analysis where the Corine Land Cover (CLC) 2000-2018 series indicated no land use change between 2000-2018.
For references, please go to https://www.eea.europa.eu/data-and-maps/figures/drought-impact-intensity-and-area or scan the QR code.
PDF generated on 02 Dec 2023, 10:20 PM
Engineered by: EEA Web Team
Software updated on 26 September 2023 08:13 from version 23.8.18
Software version: EEA Plone KGS 23.9.14
Document Actions
Share with others