All official European Union website addresses are in the europa.eu domain.
See all EU institutions and bodiesAn official website of the European Union | How do you know?
Environmental information systems
EN
- БългарскиBG
- češtinaCS
- HrvatskiHR
- danskDA
- NederlandsNL
- ελληνικάEL
- EnglishEN
- eestiET
- SuomiFI
- FrançaisFR
- DeutschDE
- magyarHU
- ÍslenskaIS
- italianoIT
- LatviešuLV
- lietuviųLT
- MaltiMT
- NorskNO
- polskiPL
- PortuguêsPT
- RomânăRO
- slovenčinaSK
- SlovenščinaSL
- EspañolES
- SvenskaSV
- TürkçeTR
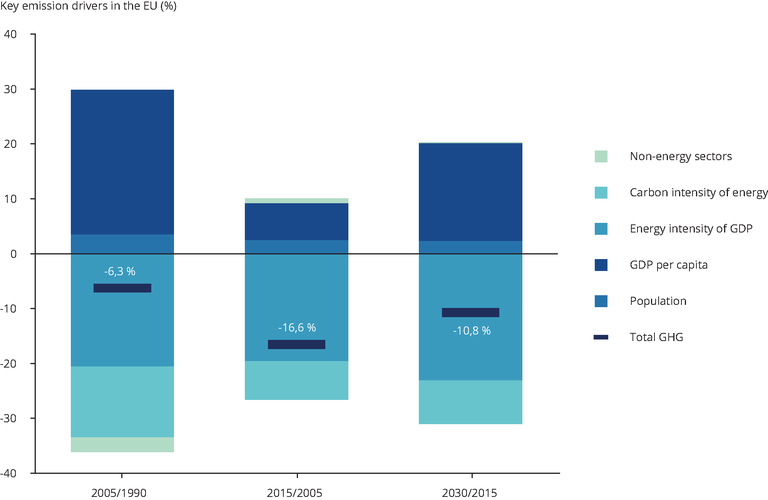
Drivers of GHG emission reductions in the EU-28, 1990-2017
Chart (static)
Drivers of GHG emission reductions from 1990 to 2017.
Downloads
Data sources
Metadata
More info
Loading
- Austria
- Belgium
- Bulgaria
- Croatia
- Cyprus
- Czechia
- Denmark
- Estonia
- Finland
- France
- Germany
- Greece
- Hungary
- Ireland
- Italy
- Latvia
- Lithuania
- Luxembourg
- Malta
- Netherlands
- Poland
- Portugal
- Romania
- Slovakia
- Slovenia
- Spain
- Sweden
- United Kingdom
1990-2017
The decomposition analysis is based on the logarithmic mean Divisia index (LMDI). The bar segments show the changes associated with each factor alone, holding the respective other factors constant. Projections at EU level have been aggregated on the basis of Member States’ submissions under EU reporting requirements. GHG emissions projections in this figure refer to those in the ‘with existing measures’ scenario. The EU Reference Scenario 2016 from the European Commission (based on the PRIMES and GAINS models) was used to gap-fill incomplete reporting for specific Member States’ variables.