next
previous
items

Figure

Distribution of reported data of Nationally designated areas (CDDA) - points

Figure Created 12 Nov 2009 Published 12 Nov 2009 Last modified 14 Mar 2013
1 min read
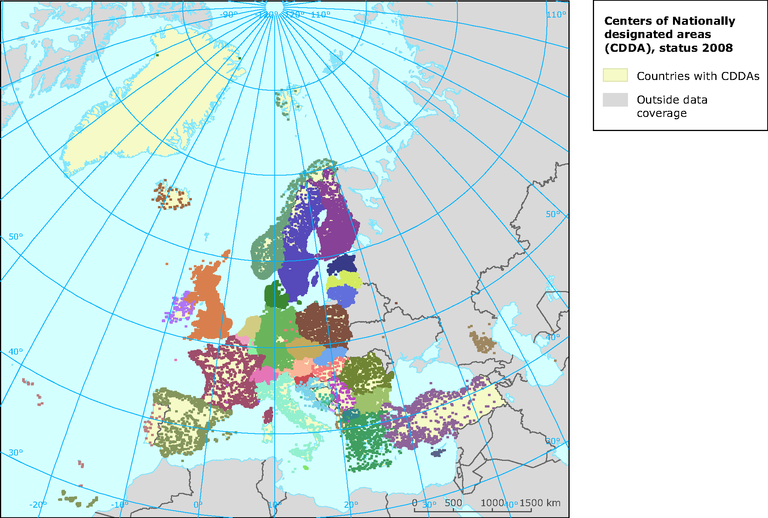
The map is intended to show the distribution of point locations reported for nationally designated areas

Download

Metadata

Additional information

The map should not be used for any purpose other than data quality documentation. Countries are working to improve the quality of the geographical information reported for nationally designated areas. See also: Distribution of data CDDA site boundaries
This information is from the European Common Database on Designated Areas established and managed collaboratively by the European Environment Agency, the UNEP-World Conservation Monitoring Centre and the Council of Europe, based on data provided by national sources.

Permalinks

Geographic coverage

Temporal coverage

Tags

Filed under: etc/npb, cdda, protected areas
Document Actions