All official European Union website addresses are in the europa.eu domain.
See all EU institutions and bodiesAn official website of the European Union | How do you know?
Environmental information systems
EN
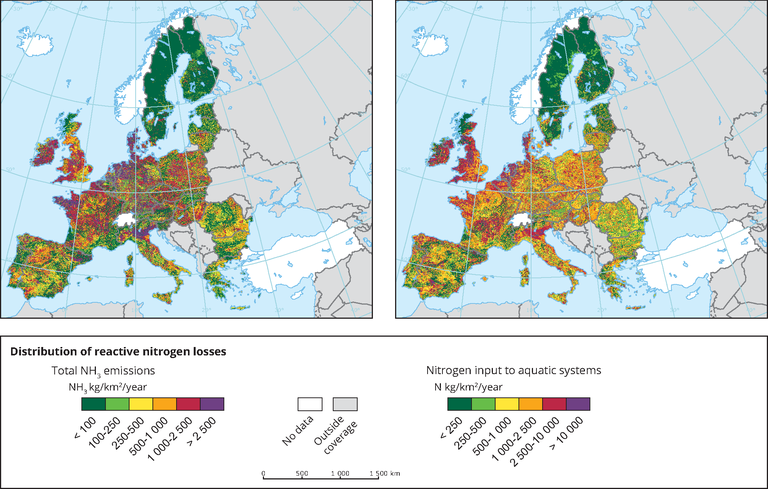
Left map shows the sum of NH3 emissions from terrestrial ecosystems, industry and waste management for a grid of 1 km × 1 km. Right map shows total Nr point sources from sewerage systems and diffuse sources from agriculture and forest soils and atmospheric Nr deposition to inland water surfaces for a grid at of 1 km × 1 km.
Loading