All official European Union website addresses are in the europa.eu domain.
See all EU institutions and bodiesAn official website of the European Union | How do you know?
Environmental information systems
EN
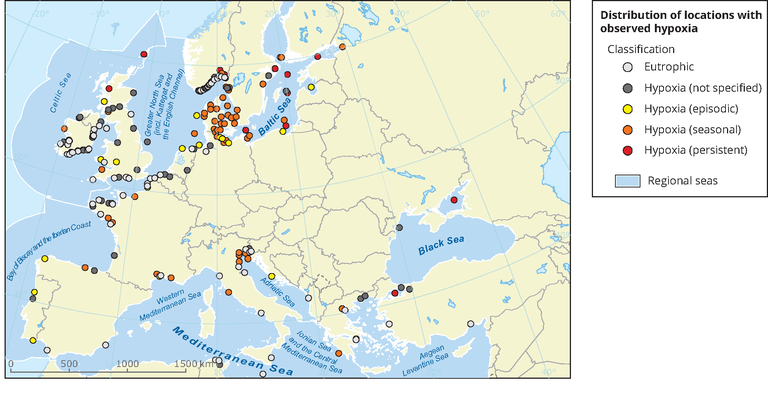
Circles depict scientifically reported accounts of eutrophication-associated dead zones. The area covered by 'dead zones' is not
presented, as such information is not generally available.
Loading