All official European Union website addresses are in the europa.eu domain.
See all EU institutions and bodiesAn official website of the European Union | How do you know?
Environmental information systems
EN
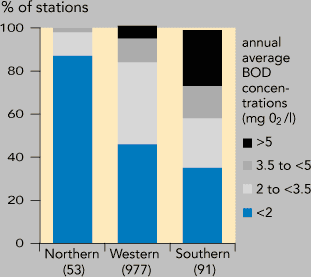
Northern: Finland (BOD7); Southern: Greece and Italy (BOD5); Western: Austria, Belgium, France, Ireland, Denmark, the Netherlands and the United Kingdom (BOD5)
Loading