All official European Union website addresses are in the europa.eu domain.
See all EU institutions and bodiesAn official website of the European Union | How do you know?
Environmental information systems
EN
All official European Union website addresses are in the europa.eu domain.
See all EU institutions and bodiesChart (static)
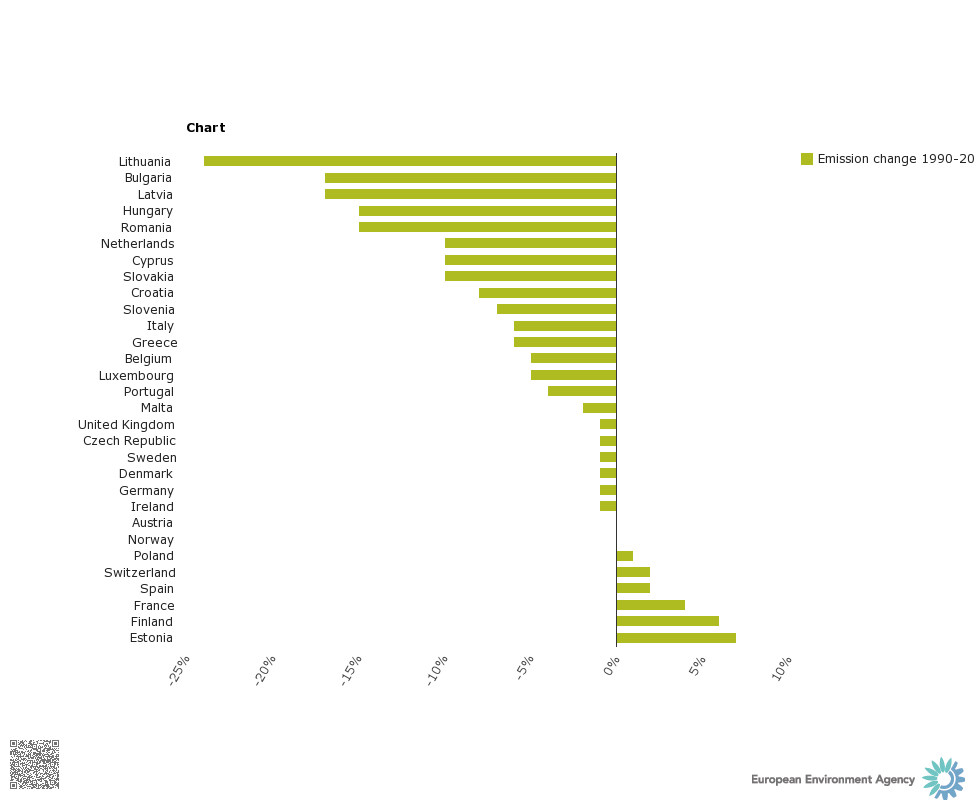
Note: The distance-to-target indicator shows how current NH3 emissions compare to a linear emission reduction 'target-path' between 2011 emission levels and 2020 Gothenburg emission ceilings for each country. Negative percentage values indicate the current emissions in a country are below the linear target path; positive values show that current emission lie above a linear target path to 2020.