All official European Union website addresses are in the europa.eu domain.
Chart (static)Published 12 Nov 2009Modified 11 Sept 2024
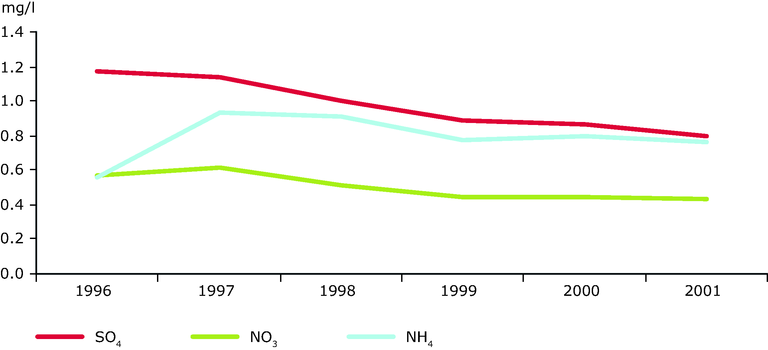
Geographical coverage note: Plots are located in 14 mostly central European countries and are not representative of the European scale.