All official European Union website addresses are in the europa.eu domain.
See all EU institutions and bodiesAn official website of the European Union | How do you know?
Environmental information systems
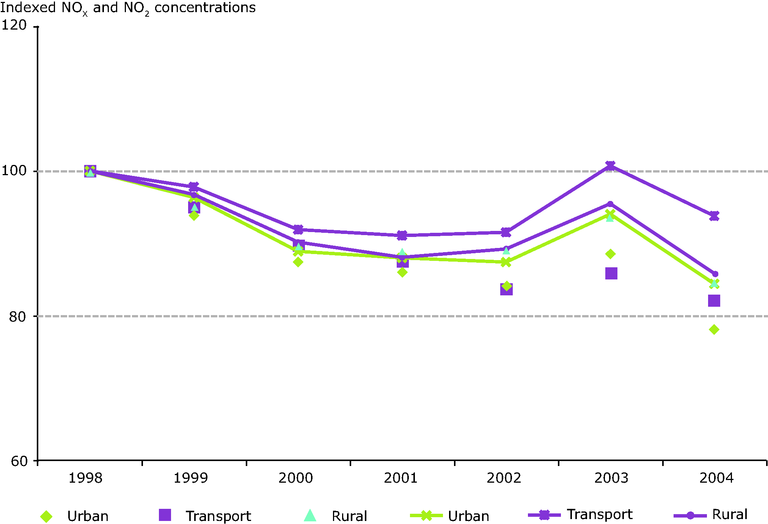
Development of concentrations of NOX (dots) and NO2 (lines) at 450 urban, transport and rural stations in eight countries with NOX and NO2 data for all years 1998-2004
Chart (static)

Downloads
Data sources
Metadata
More info
Loading
- Austria
- Belgium
- Czechia
- Denmark
- Germany
- Netherlands
- Switzerland
