All official European Union website addresses are in the europa.eu domain.
See all EU institutions and bodiesAn official website of the European Union | How do you know?
Environmental information systems
EN
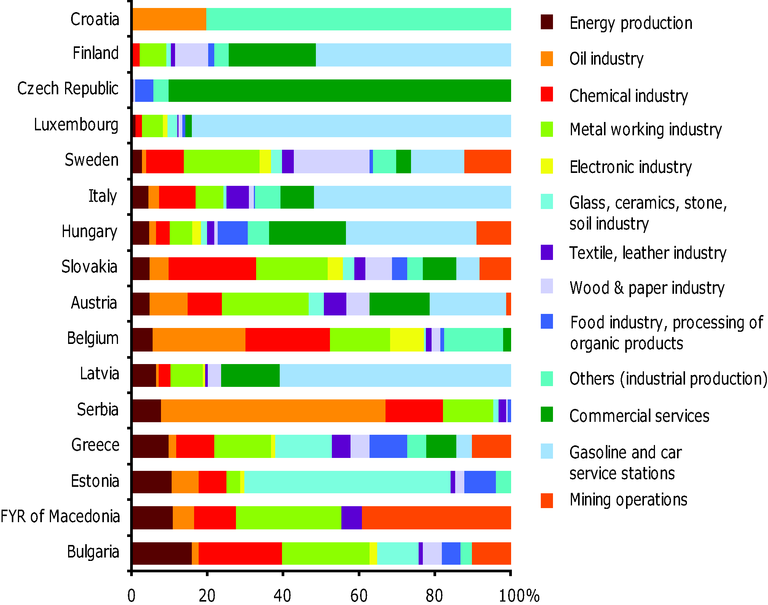
The graph shows a breakdown of the industrial and commercial activities causing soil contamination as % of the number of sites for each branch of activity
Loading