Figure
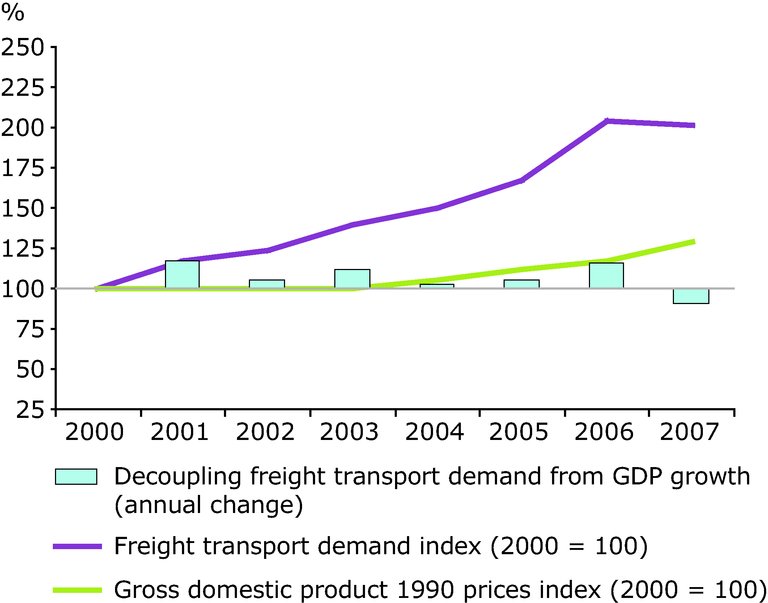
Decoupling of freight transport demand in the Western Balkans, 2000–2007
Documents
Metadata
Additional information
The decoupling indicator is calculated as the ration of freight transport demand to GDP measured in 1990 US$ market prices. The bars depict the intensity of transport demand in the current year in relation to the intensity in the previous year. An index above 100 results from transport demand outpacing GDP growth (i.e. positive bar = no decoupling) whereas an index below 100 is explained by transport demand growing less rapidly than GDP (i.e. negative bar = decoupling).
Permalinks
- Permalink to this version
- 3ca070906bf1b5e966fdf91b1a003328
- Permalink to latest version
- 024DO3NWHJ
Geographic coverage
Temporal coverage
For references, please go to https://www.eea.europa.eu/data-and-maps/figures/decoupling-of-freight-transport-demand or scan the QR code.
PDF generated on 04 Feb 2023, 10:24 AM
Document Actions
Share with others