All official European Union website addresses are in the europa.eu domain.
See all EU institutions and bodies
An official website of the European Union | How do you know?
Environmental information systems
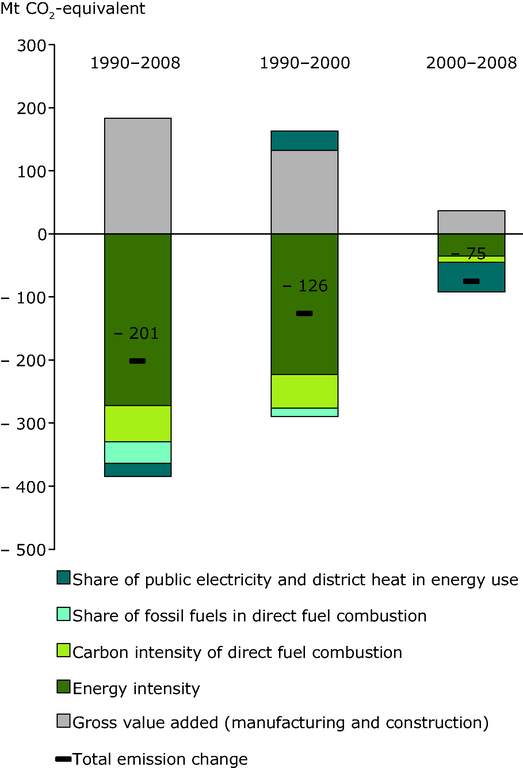
Each bar shows the contribution of a single driver on GHG emission trends during a determined period. The thick short black lines indicate the combined effect of all emission drivers, i.e. the overall GHG emission trend during the period considered.
Loading