Figure
Decapod abundance in the central North Sea 1950-2005
Metadata
Additional information
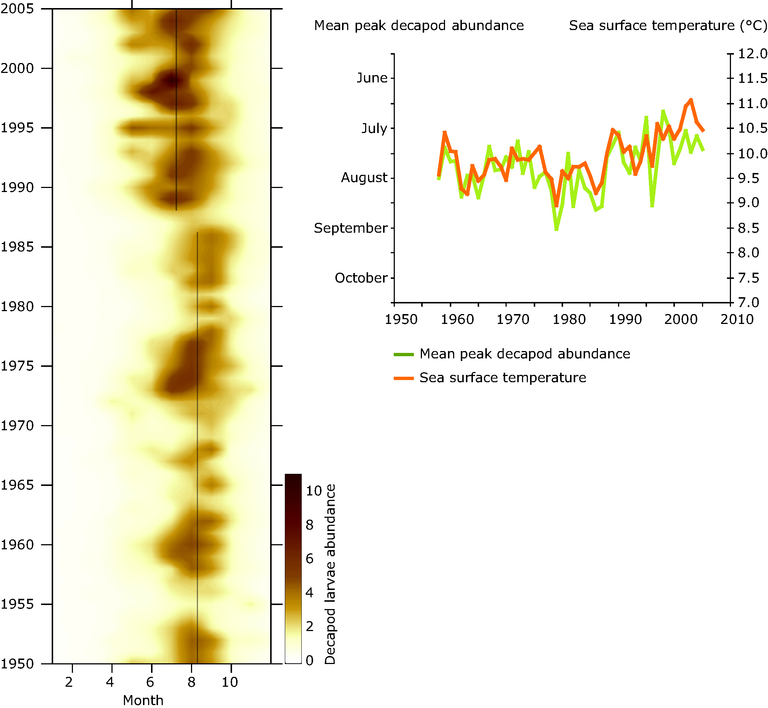
month plot is highlighting the mean seasonal peak in the decapod abundance. Right: the month of seasonal peak of decapod larvae for each year 1958-2005 (green line) shown together with sea surface temperature (orange line).
Geographical coverage note: North Sea
Permalinks
- Permalink to this version
- 8DE15CDC-C1A9-4FB5-B252-F80D00C2E74C
- Permalink to latest version
- F6F82E7A-91D9-48EF-92F5-96C739DBFB05
Geographic coverage
Temporal coverage
For references, please go to https://www.eea.europa.eu/data-and-maps/figures/decapod-abundance-in-the-central-north-sea-1950-2005 or scan the QR code.
PDF generated on 29 Jan 2023, 05:34 PM
Document Actions
Share with others