All official European Union website addresses are in the europa.eu domain.
See all EU institutions and bodies
An official website of the European Union | How do you know?
Environmental information systems
EN

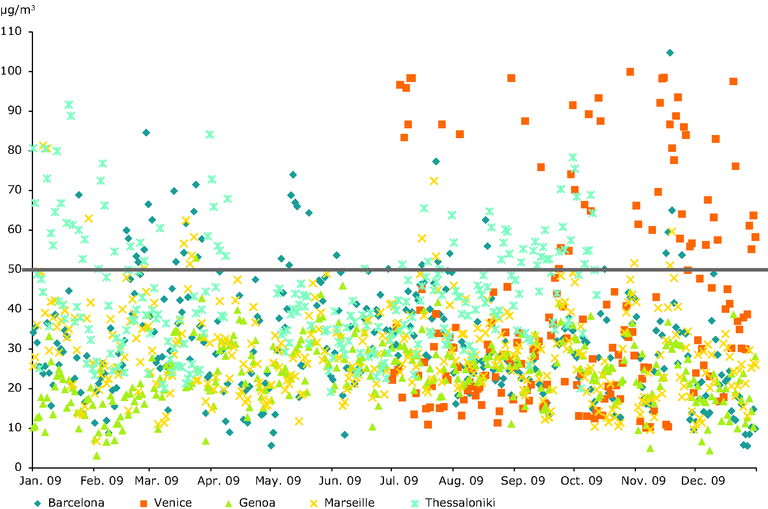
The daily variation and exceedances of PM10 concentrations during 2009 at a monitoring station that is directly affected by the port in each of these five European port cities. The red line shows the daily limit value. This illustrates significant exceedances.
Loading