All official European Union website addresses are in the europa.eu domain.
See all EU institutions and bodies
An official website of the European Union | How do you know?
Environmental information systems
EN

- БългарскиBG
- češtinaCS
- HrvatskiHR
- danskDA
- NederlandsNL
- ελληνικάEL
- EnglishEN
- eestiET
- SuomiFI
- FrançaisFR
- DeutschDE
- magyarHU
- ÍslenskaIS
- italianoIT
- LatviešuLV
- lietuviųLT
- MaltiMT
- NorskNO
- polskiPL
- PortuguêsPT
- RomânăRO
- slovenčinaSK
- SlovenščinaSL
- EspañolES
- SvenskaSV
- TürkçeTR
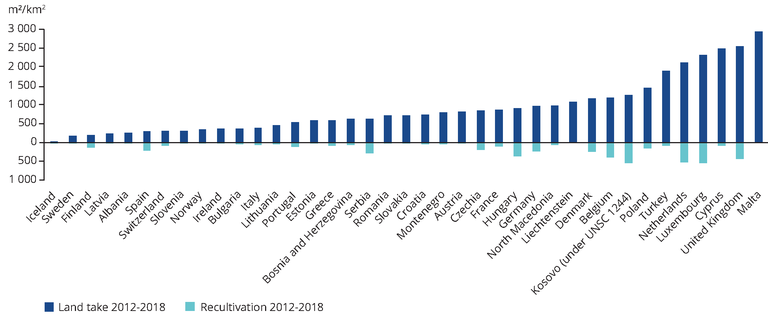
Country comparison: land take and land recultivation in EEA39 in the period 2012-2018 (in proportion of country area).
Map (static)
The chart shows the area of land take and recultivation for the last Corine Land Cover observation period 2012-2018 for each EEA39 country. Both land take and recultivation are expressed in m2/km2 of the country area for the sake of comparability.
Downloads
Data sources
Metadata
More info
Loading
- Albania
- Austria
- Belgium
- Bosnia and Herzegovina
- Bulgaria
- Croatia
- Cyprus
- Czechia
- Denmark
- Estonia
- Finland
- France
- Germany
- Greece
- Hungary
- Iceland
- Ireland
- Italy
- Kosovo
- Latvia
- Liechtenstein
- Lithuania
- Luxembourg
- Malta
- Montenegro
- Netherlands
- North Macedonia
- Norway
- Poland
- Portugal
- Romania
- Serbia
- Slovakia
- Slovenia
- Spain
- Sweden
- Switzerland
- United Kingdom
2012-2018
Methodology
European land take statistics for the 2000-2018 period. The indicator is calculated from Corine Land Cover 2000, 2006, 2012 and 2018 data mapped from Landsat, SPOT, IRS and RapidEye satellite images (version 20b2). Changes from agricultural (CLC class 2xx), forest and semi-natural/natural land (CLC class 3xx), wetlands (CLC class 4xx) or water (CLC 5xx) to urban (CLC class 1xx) are grouped according to the land cover accounts methodology. Land cover change values are converted to grid cells, which are aggregated by countries. In addition to comparable results between countries, the use of the CLC geographic database allows the same indicator to be computed for smaller units such as regions or river basins. When the indicator refers to country surface, areas are calculated for consistency reasons from the same CLC database as used for the indicator; it may lead to small differences with official country surface numbers due to the use of a single geographical projection system.
The datasets was processed according to the 2016 EEA land accounting methodology and updated country boundaries. In this methodology land take is define the following way:
Land take = LCF2 (21+22) + LCF3 (31+32+33+34+35+36+37+38) + LCF13 (development of green urban areas over previously undeveloped land) - part of LCF38 (conversion of sport and leisure facilities from previously developed land)
Only polygonal transport areas are recorded in the indicator. Land uptake by linear transport infrastructure development will be integrated in a further step on the basis of a high resolution geographical database of transport infrastructures.