All official European Union website addresses are in the europa.eu domain.
See all EU institutions and bodiesAn official website of the European Union | How do you know?
Environmental information systems
EN
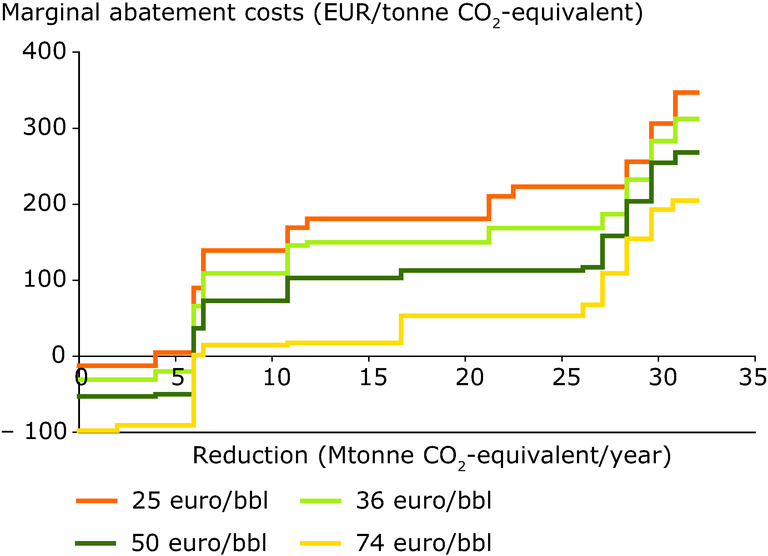
The figure shows costs and the reduction potential of different kinds of measures for the passenger car vehicle fleet (new + existing), ranging from technological fuel efficiency measures for new cars to eco-driving
Loading