All official European Union website addresses are in the europa.eu domain.
See all EU institutions and bodiesAn official website of the European Union | How do you know?
Environmental information systems
EN
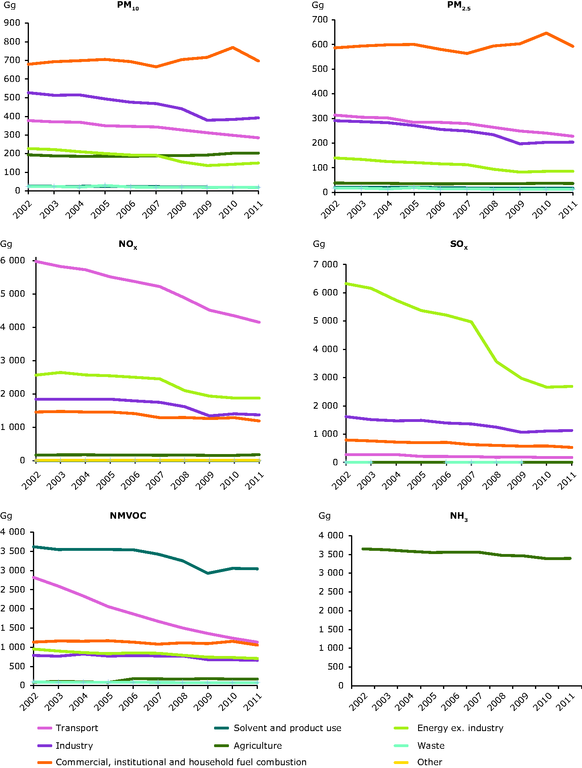
This figure shows the sectoral output of primary PM and precursor gases
Various source sectors contribute to the primary
anthropogenic PM and precursor gases
Loading