All official European Union website addresses are in the europa.eu domain.
See all EU institutions and bodies
An official website of the European Union | How do you know?
Environmental information systems
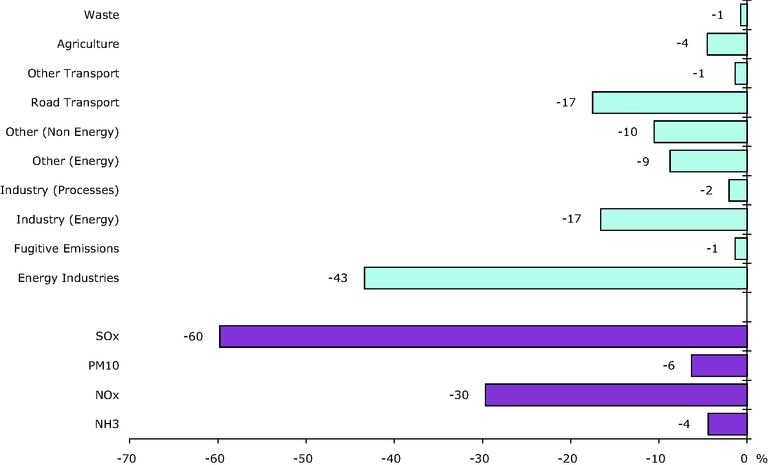
'Contribution to change' plots show the contribution to the total emission change between 1990-2006 made by a specified sector/ pollutant
Loading