All official European Union website addresses are in the europa.eu domain.
See all EU institutions and bodiesAn official website of the European Union | How do you know?
Environmental information systems
EN
- БългарскиBG
- češtinaCS
- HrvatskiHR
- danskDA
- NederlandsNL
- ελληνικάEL
- EnglishEN
- eestiET
- SuomiFI
- FrançaisFR
- DeutschDE
- magyarHU
- ÍslenskaIS
- italianoIT
- LatviešuLV
- lietuviųLT
- MaltiMT
- NorskNO
- polskiPL
- PortuguêsPT
- RomânăRO
- slovenčinaSK
- SlovenščinaSL
- EspañolES
- SvenskaSV
- TürkçeTR
Consumption of chemical groups in the EU, 2004-2020, indexed to 2004
Chart (static)
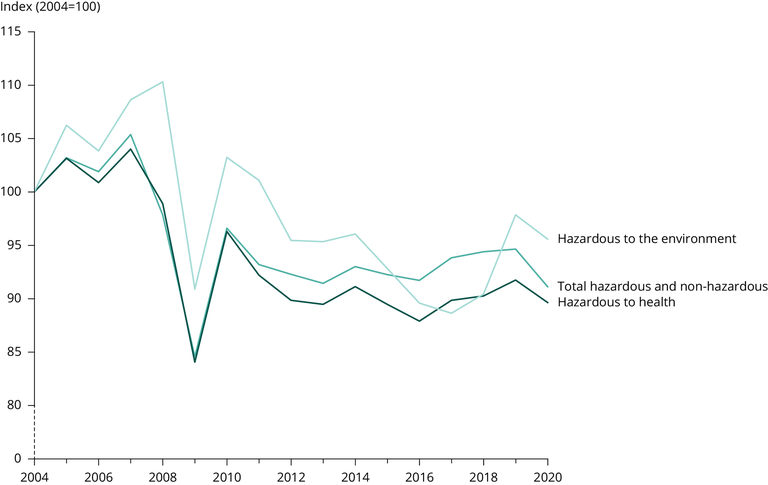
This indicator is based on a selected number of hazardous and non-hazardous chemicals and often aggregates multiple substances into one category. Therefore, trends should be interpreted with caution.
Downloads
Data sources
Metadata
More info
Loading
- Production and consumption of chemicals by hazard class
- Austria
- Belgium
- Bulgaria
- Croatia
- Cyprus
- Czechia
- Denmark
- Estonia
- Finland
- France
- Germany
- Greece
- Hungary
- Ireland
- Italy
- Latvia
- Lithuania
- Luxembourg
- Malta
- Netherlands
- Poland
- Portugal
- Romania
- Slovakia
- Slovenia
- Spain
- Sweden
2004-2020
Additional information
This graph is reproduced from data published by Eurostat, for further details see https://ec.europa.eu/eurostat/statistics-explained/index.php?title=Chemicals_production_and_consumption_statistics.