All official European Union website addresses are in the europa.eu domain.
See all EU institutions and bodies
An official website of the European Union | How do you know?
Environmental information systems
EN

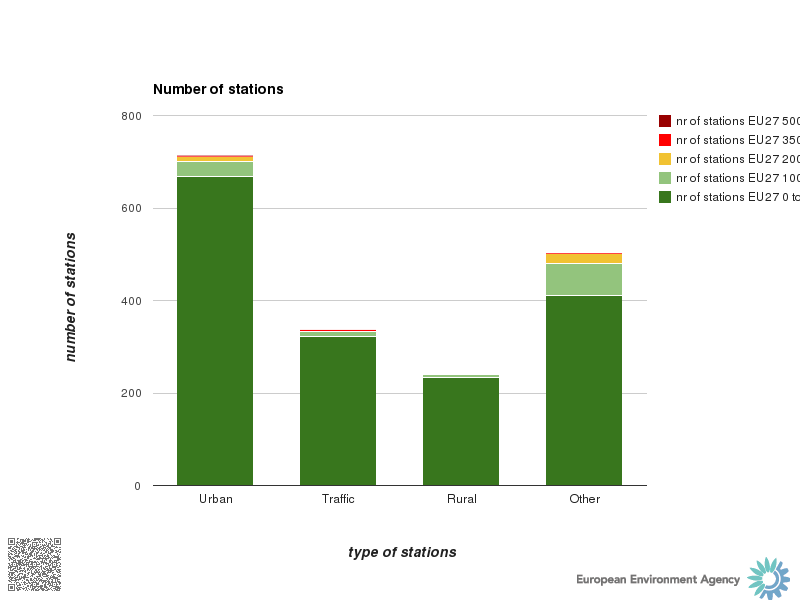
Distribution of stations by thresholds of 99.73 percentile of the hourly SO2 concentrations for the year 2011. The chart is based on the 99.73 percentile of the SO2 hourly concentrations, corresponding to the 25th highest SO2 concentration when data availability is 100% over the year.