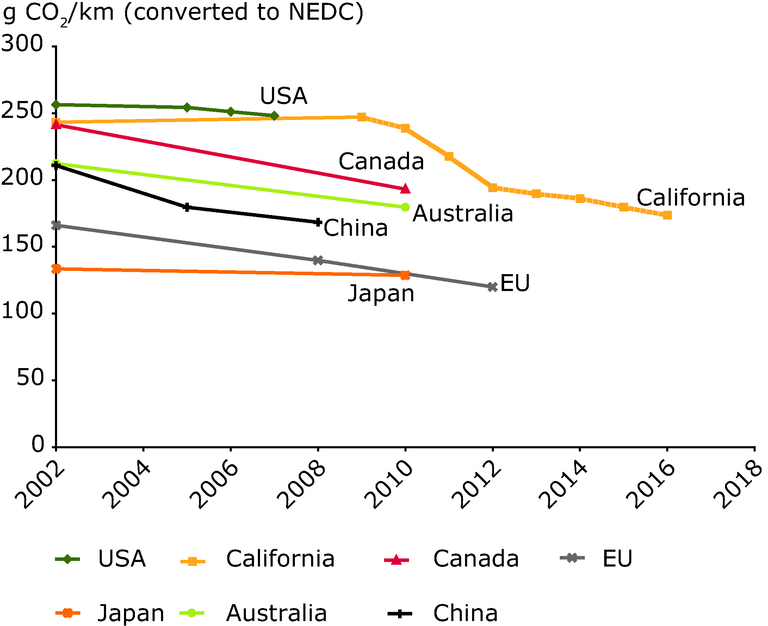
All standards have been converted to the European drive-cycle for comparison. The 2012 figure for the EU assumes that the 120 g/km aim is adhered to. NB: Dotted lines denote proposed standards. Standards are not always directly comparable since different countries use different test cycles and measures (e.g. the EU uses grams of CO2/km, whereas the USA sets standards in terms of miles per gallon). In this graph all standards are converted to grams of CO2/km, according to the new European drive cycle (NEDC).
Geographical coverage note: USA, California, Canada, EU, Japan, Australia, China