Annual growth rate = (GDP2010/GDP2007)1/3-1.
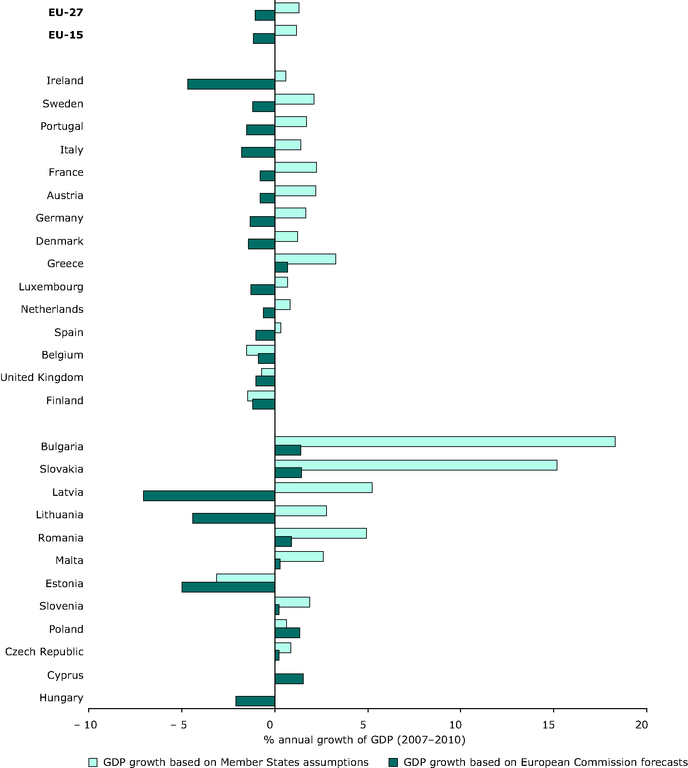
Member States are grouped by region (EU‑15, EU‑12) and ranked according to the decreasing gap between the two estimates of average annual growth rate 2007–2010.
European Commission forecasts: GDP from AMECO provided in 2000 constant prices. Short‑term economic forecasts produced by DG ECFIN, under its own responsibility, twice a year.
Member States assumptions: GDP provided by Member States for 2005 and 2010, in 2000 constant prices, except for France, the Netherlands and the United Kingdom (not defined), Germany and Ireland (2005 prices) and Belgium (other). The 2007 GDP values were estimated by EEA, based on 2005 values reported by countries and 2005–2007 growth rates based on AMECO data.
No 2010 GDP assumptions available for Cyprus and Hungary. The 2010 GDP for EU‑27 was estimated using 2005 GDP values for these two countries.