All official European Union website addresses are in the europa.eu domain.
See all EU institutions and bodiesAn official website of the European Union | How do you know?
Environmental information systems
EN
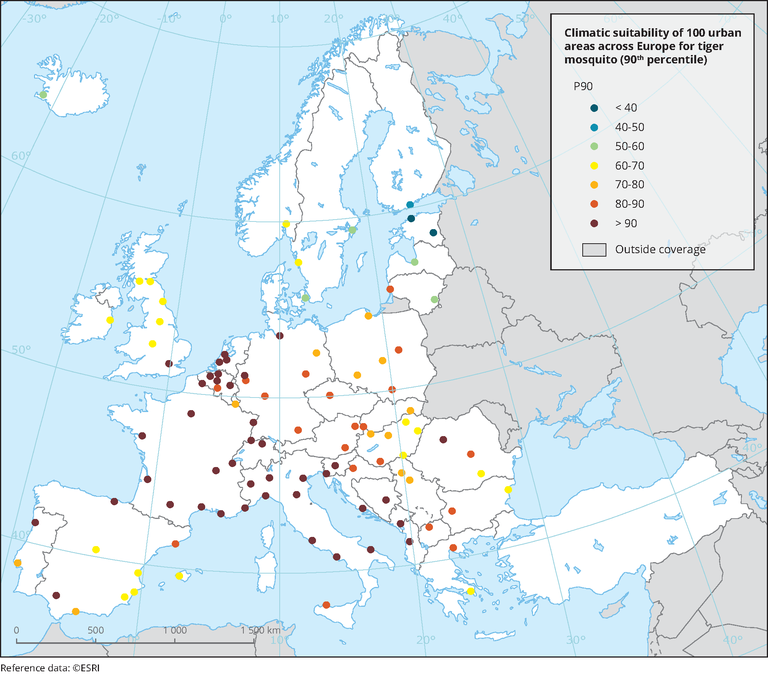
The selection of cities comes from the source data. The P90 (90th percentile) indicator of the climatic suitability of the urban area for tiger mosquito represents the specific exposure of single cities and is independent of the model domain or size of a city. Since it is the 90th percentile, there are grid cells (areas) in a city with an even higher suitability value, so it can be considered a rather conservative value. For specific values for individual cities, see the Urban Adaptation Map Viewer.
Loading