All official European Union website addresses are in the europa.eu domain.
See all EU institutions and bodies
An official website of the European Union | How do you know?
Environmental information systems
EN

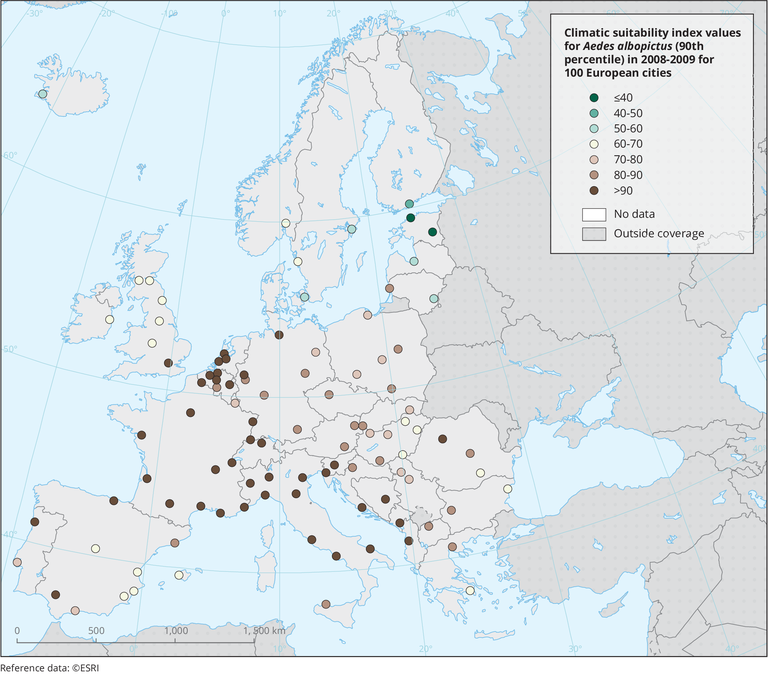
The climatic suitability is an index ranging from 0 to 100. The P90 indicator of the climatic suitability is the 90th percentile value of the index range modelled across the city. The modelling is based on 100m resolution hourly temperature data (based on simulations with the urban climate model UrbClim). From this dataset, the climate suitability has been generated based on annual precipitation and the average temperature in January and during the summer months for the years 2008-2009. The selection of cities comes from the source data. For specific values for individual cities, see the Urban Adaptation Map Viewer.
Loading