All official European Union website addresses are in the europa.eu domain.
See all EU institutions and bodies
An official website of the European Union | How do you know?
Environmental information systems
EN

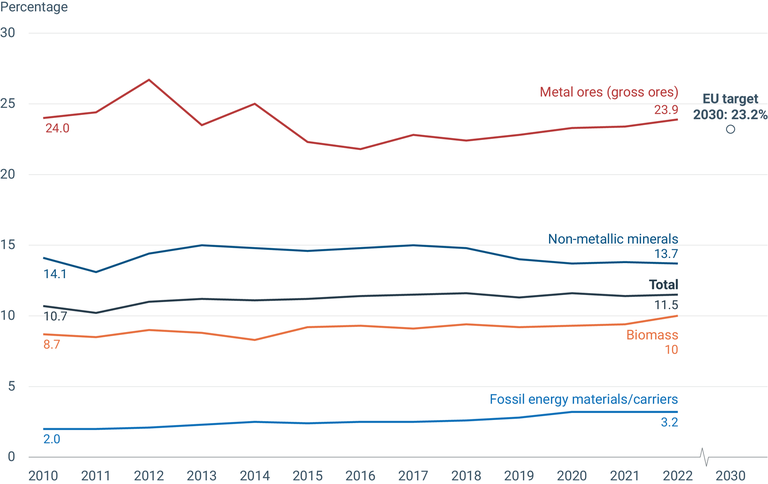
The black line indicates changes in the total circular material use rate for the EU over time, while the coloured lines show changes in the circular material use rates for the various material groups.
Loading