All official European Union website addresses are in the europa.eu domain.
See all EU institutions and bodies
An official website of the European Union | How do you know?
Environmental information systems
EN

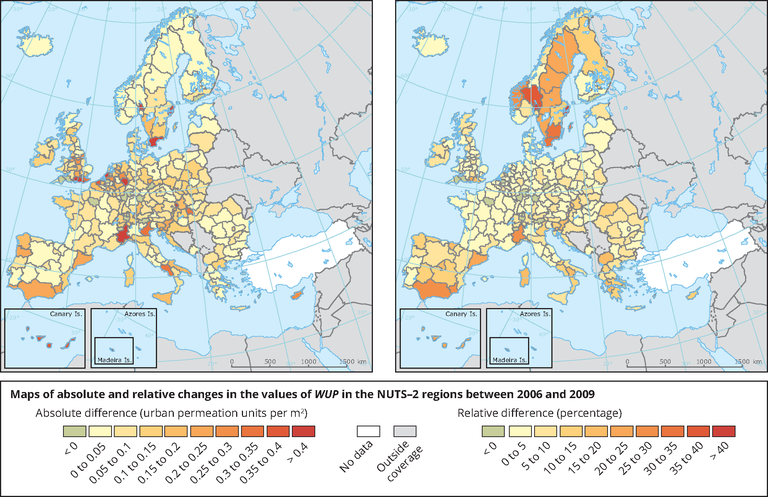
Maps of absolute and relative changes in the values of WUP in the NUTS-2 regions between 2006 and 2009.
Loading