All official European Union website addresses are in the europa.eu domain.
See all EU institutions and bodies
- БългарскиBG
- češtinaCS
- HrvatskiHR
- danskDA
- NederlandsNL
- ελληνικάEL
- EnglishEN
- eestiET
- SuomiFI
- FrançaisFR
- DeutschDE
- magyarHU
- ÍslenskaIS
- italianoIT
- LatviešuLV
- lietuviųLT
- MaltiMT
- NorskNO
- polskiPL
- PortuguêsPT
- RomânăRO
- slovenčinaSK
- SlovenščinaSL
- EspañolES
- SvenskaSV
- TürkçeTR
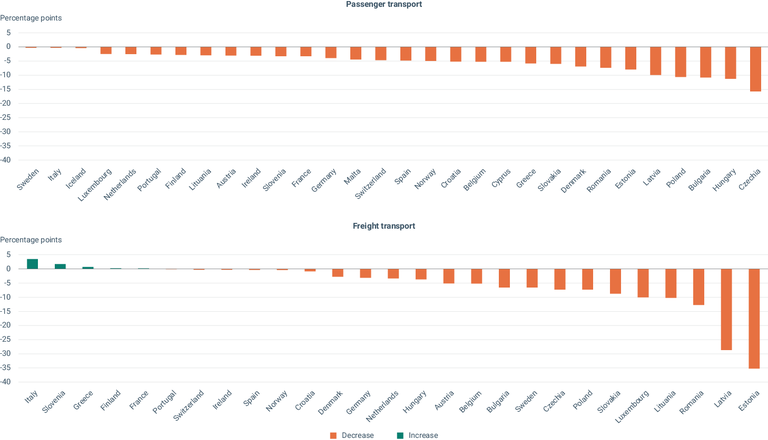
Changes in the share of collective modes in inland passenger transport and of non-road modes in inland freight transport across European countries between 2010 and 2021
Chart (static)
The figure shows the percentage point variations in the share of buses, trains, trams and metro (collective modes) and of inland waterways and trains (non-road modes) in total inland passenger and freight transport activities respectively by country.

- Statistical pocketbook 2023, section 23
- Statistical pocketbook 2023, section 22
- Austria
- Belgium
- Bulgaria
- Croatia
- Cyprus
- Czechia
- Denmark
- Estonia
- Finland
- France
- Germany
- Greece
- Hungary
- Iceland
- Ireland
- Italy
- Latvia
- Lithuania
- Luxembourg
- Malta
- Norway
- Poland
- Portugal
- Romania
- Slovakia
- Slovenia
- Spain
- Sweden
- Switzerland
- The Netherlands
Methodology
Raw data by country on changes (between 2010 and 2021) in the shares of collective and of non-road transport modes in total inland passenger and freight transport activity, respectively, were retrieved from the 2023 version of the statistical pocketbook EU transport in figures published by the Directorate-General for Mobility and Transport. Data are displayed at country level and are expressed in percentage points. To provide the broadest possible picture of European countries, geographical coverage was extended to the 32 EEA member countries and the Western Balkan cooperating countries when data were available. No additional gap filling was applied to the data.
Additional information
The variation is in percentage points and it is calculated as difference between shares in 2010 and 2021 period. Collective modes refer to passenger transport via buses, including coaches and trolley-buses, trains, trams and metro. Non-road modes refer to freight transport through trains and inland waterways. Total inland passenger transport performance includes transport by passenger cars, buses and coaches, and trains. Total inland freight transport performance includes transports by road, rail and inland waterways.
