All official European Union website addresses are in the europa.eu domain.
See all EU institutions and bodies
An official website of the European Union | How do you know?
Environmental information systems
EN

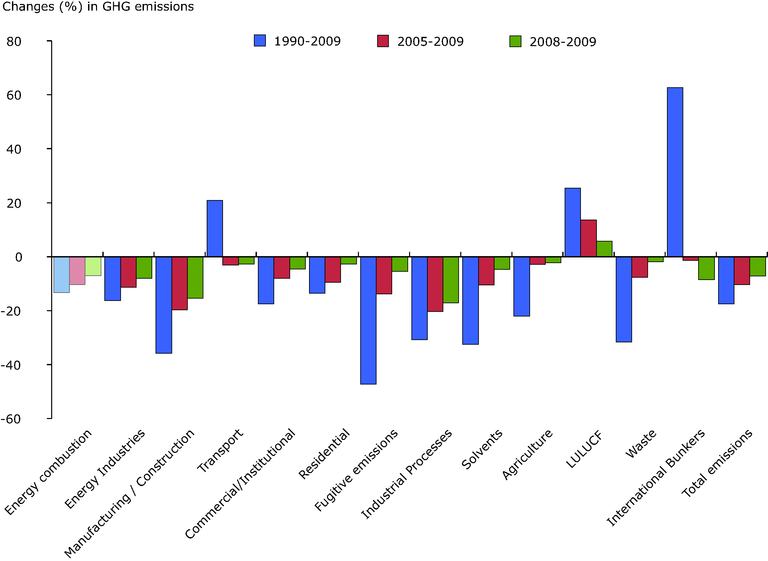
International bunkers are international transport emissions (Memo items: international aviation and international maritime transport) and are shown in the chart because they are the fastest growing source of emissions in the EU. They are however not included in the national totals reported as part of the national greenhouse gas inventories under the UNFCCC. The sector LULUCF (Land use, land use change and forestry) is not included in the national totals under the UNFCCC either. LULUCF in the EU is a net carbon sink, resulting from higher removals by sinks than emissions from sources. A positive change in LULUCF means a reduction in emissions (i.e. a removal of emissions).
Loading