All official European Union website addresses are in the europa.eu domain.
See all EU institutions and bodiesAn official website of the European Union | How do you know?
Environmental information systems
EN
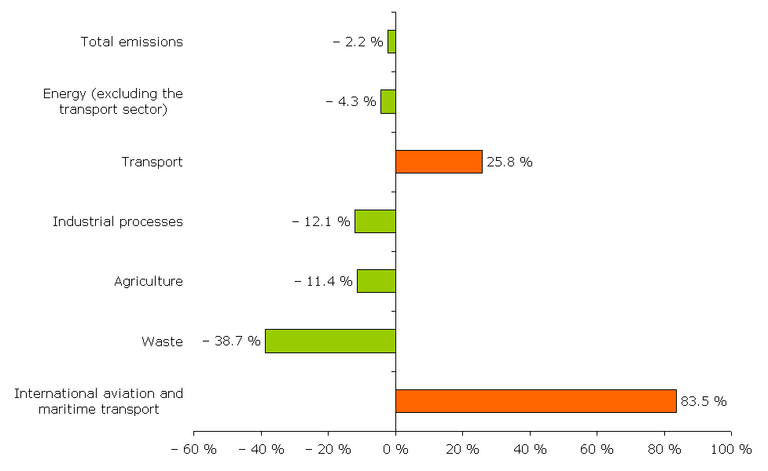
The categories Total emissions, Energy and Transport do not include emissions and removals from LULUCF (carbon sink activities) and emissions from international bunkers (international aviation and maritime transport).
Loading