All official European Union website addresses are in the europa.eu domain.
See all EU institutions and bodiesAn official website of the European Union | How do you know?
Environmental information systems
EN
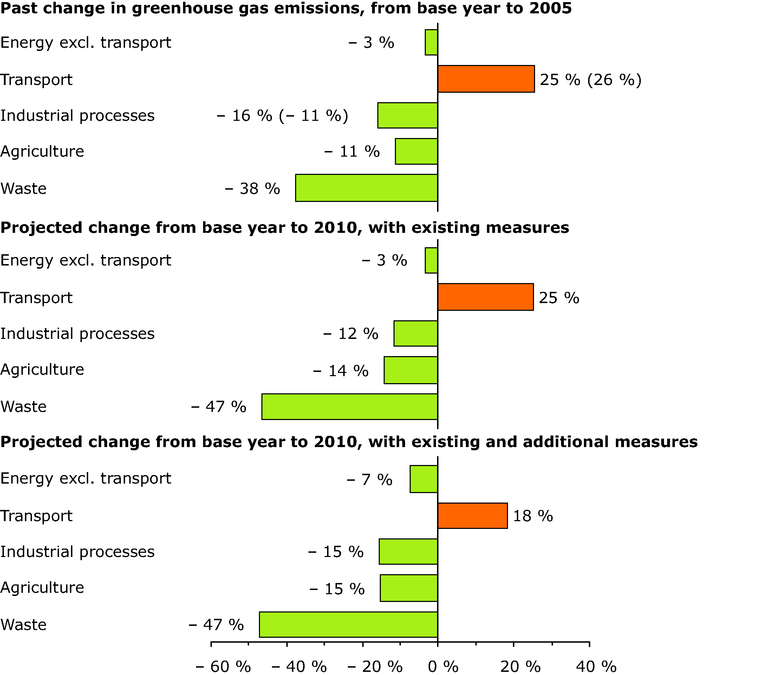
The numbers presented correspond to changes compared to base-year emissions except for the numbers in brackets (past trends for transport and industrial processes), which correspond to changes compared to 1990
Loading