All official European Union website addresses are in the europa.eu domain.
See all EU institutions and bodies
An official website of the European Union | How do you know?
Environmental information systems
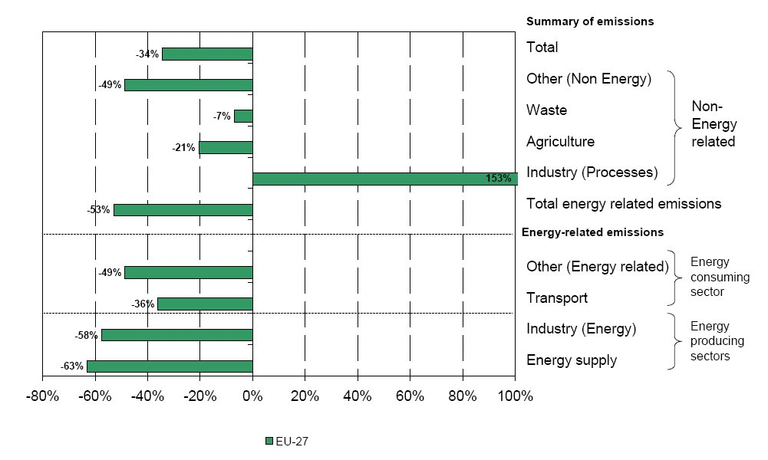
Changes (%) in emissions of primary and secondary PM10 particulate matter emissions by source category, 1990-2005, EU-27 (weighted by tropospheric ozone formation potential)
Chart (static)
Downloads
Data sources
Metadata
More info
Loading
The graph shows the emissions of primary PM10 particles (particulate matter with a diameter of 10 μm or less, emitted directly into the atmosphere) and secondary particulate-forming pollutants (the fraction of sulphur dioxide, SO2, nitrogen oxides NOx and ammonia NH3 which, as a result of photo-chemical reactions in the atmosphere, transform into particulate matter with a diameter of 10μm or less). Emissions of the secondary particulate precursor species are weighted by a particle formation factor prior to aggregation: primary PM10 = 1, SO2 = 0.54, NOx = 0.88, and (NH3) = 0.64 (de Leeuw, 2002).