All official European Union website addresses are in the europa.eu domain.
See all EU institutions and bodies
An official website of the European Union | How do you know?
Environmental information systems
EN

- БългарскиBG
- češtinaCS
- HrvatskiHR
- danskDA
- NederlandsNL
- ελληνικάEL
- EnglishEN
- eestiET
- SuomiFI
- FrançaisFR
- DeutschDE
- magyarHU
- ÍslenskaIS
- italianoIT
- LatviešuLV
- lietuviųLT
- MaltiMT
- NorskNO
- polskiPL
- PortuguêsPT
- RomânăRO
- slovenčinaSK
- SlovenščinaSL
- EspañolES
- SvenskaSV
- TürkçeTR
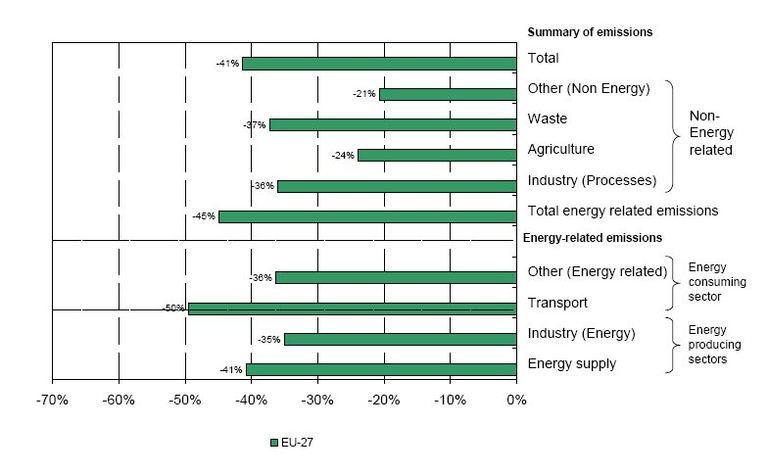
Changes (%) in emissions of ozone precursors by source category, 1990-2005, EU-27 (weighted by tropospheric ozone formation potential)
Chart (static)
Downloads
Data sources
Metadata
More info
Loading
The graph above shows the emissions of ozone precursors (methane CH4; carbon monoxide CO; non-methane volatile organic compounds NMVOCs; and nitrogen oxides NOx) each weighted by a factor prior to aggregation to represent their respective tropospheric ozone formation potential (TOFP). The TOFP factors are: NOx 1.22, NMVOC 1, CO 0.11 and CH4 0.014 (de Leeuw 2002). Results are expressed in NMVOC equivalents (kilotonnes - kt). Data not available for Iceland (emissions of CO, NMVOC, NOx were not reported) and Malta (CO).
The energy supply sector includes public electricity and heat production (power plants), oil refining, production of solid fuels and fugitive emissions from fuels. The transport sector includes emissions from road and off-road sources (e.g. railways and vehicles used for agriculture and forestry). Industry (energy) relates to emissions from combustion processes used in the manufacturing industry including boilers, gas-turbines and stationary engines. 'Other (energy-related)' covers energy use principally in the services and household sectors.