All official European Union website addresses are in the europa.eu domain.
See all EU institutions and bodiesAn official website of the European Union | How do you know?
Environmental information systems
EN
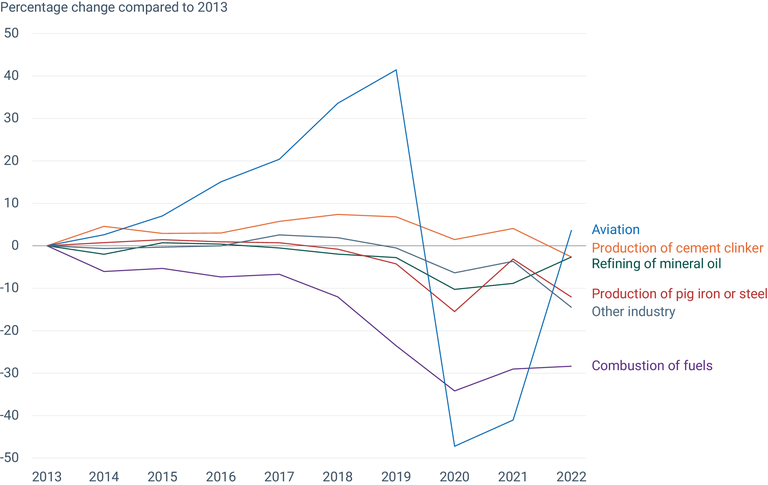
This figure shows change in greenhouse gas emissions under the European Union Emissions Trading System since 2013 by industry type.
Loading