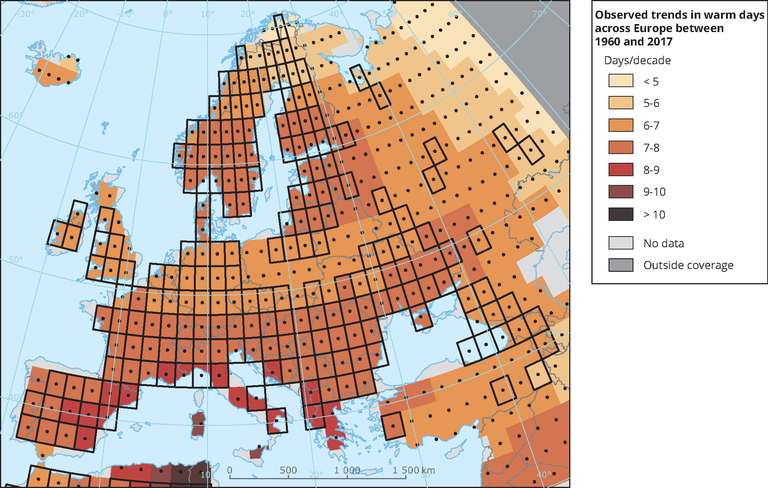
Observed trends in warm days across Europe between 1960 and 2017
Download
- 93088_Fig05 - Map - Observed trends in warm days across Europe_v2.eps.75dpi.gif (642.5 KB)
- 93088_Fig05 - Map - Observed trends in warm days across Europe_v2.eps.75dpi.tif (7.3 MB)
- 93088_Fig05 - Map - Observed trends in warm days across Europe_v2.eps.75dpi.png (163.0 KB)
- Original file application/postscript (3.03 MB)
Permalinks
- Permalink to this version
- 8f7d2445098d44e3889fbe842c9b71cf
- Permalink to latest version
- D702EDEE-08D7-4687-B717-690A71819BA8
Older versions
For references, please go to https://www.eea.europa.eu/data-and-maps/figures/changes-in-duration-of-warm-spells-in-summer-across-europe-in-the-period-1976-2006-in-days-per-decade-10 or scan the QR code.
PDF generated on 16 Feb 2019, 07:20 PM
Document Actions
Share with others