All official European Union website addresses are in the europa.eu domain.
See all EU institutions and bodiesAn official website of the European Union | How do you know?
Environmental information systems
EN
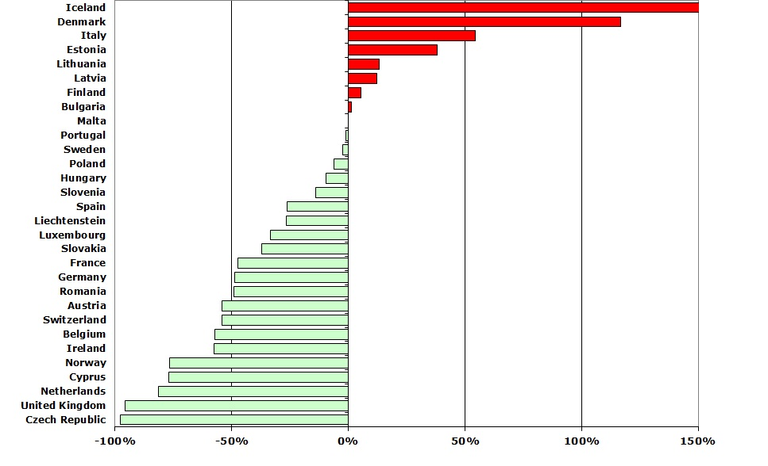
The reported change in polycyclic aromatic hydrocarbons (PAH) emissions for each country, 1990-2010.
Loading