All official European Union website addresses are in the europa.eu domain.
See all EU institutions and bodiesAn official website of the European Union | How do you know?
Environmental information systems
EN
- БългарскиBG
- češtinaCS
- HrvatskiHR
- danskDA
- NederlandsNL
- ελληνικάEL
- EnglishEN
- eestiET
- SuomiFI
- FrançaisFR
- DeutschDE
- magyarHU
- ÍslenskaIS
- italianoIT
- LatviešuLV
- lietuviųLT
- MaltiMT
- NorskNO
- polskiPL
- PortuguêsPT
- RomânăRO
- slovenčinaSK
- SlovenščinaSL
- EspañolES
- SvenskaSV
- TürkçeTR
Contribution to total change in non-methane volatile organic compounds emissions for each sector
Chart (static)
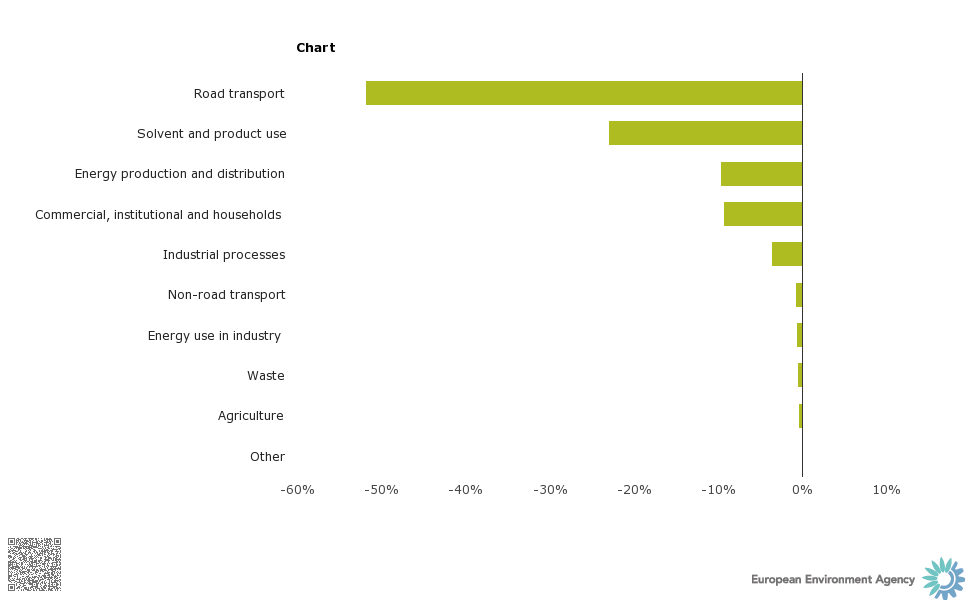
EEA aggregated and gap-filled air emission dataset, based on 2013 officially reported national total and sectoral emissions to UNECE LRTAP Convention and the EU NEC Directive.
NECD: National emission ceilings directive
UNECE: United Nations Economic Commission for Europe
LRTAP: Long-range Transboundary Air Pollution
Downloads
Data sources
Metadata
More info
- National Emission Ceilings (NEC) Directive Inventory - NFR09 sector classification, European Environment Agency (EEA)
- National greenhouse gas inventories (IPCC Common Reporting Format sector classification), European Environment Agency (EEA)
- National emissions reported to the Convention on Long-range Transboundary Air Pollution (LRTAP Convention) , European Environment Agency (EEA)
- Austria
- Belgium
- Bulgaria
- Croatia
- Cyprus
- Czechia
- Denmark
- Estonia
- Finland
- France
- Germany
- Greece
- Hungary
- Iceland
- Ireland
- Italy
- Latvia
- Liechtenstein
- Lithuania
- Luxembourg
- Malta
- Netherlands
- Norway
- Poland
- Portugal
- Romania
- Slovakia
- Slovenia
- Spain
- Sweden
- Switzerland
- United Kingdom
1990-2011