All official European Union website addresses are in the europa.eu domain.
See all EU institutions and bodiesAn official website of the European Union | How do you know?
Environmental information systems
EN
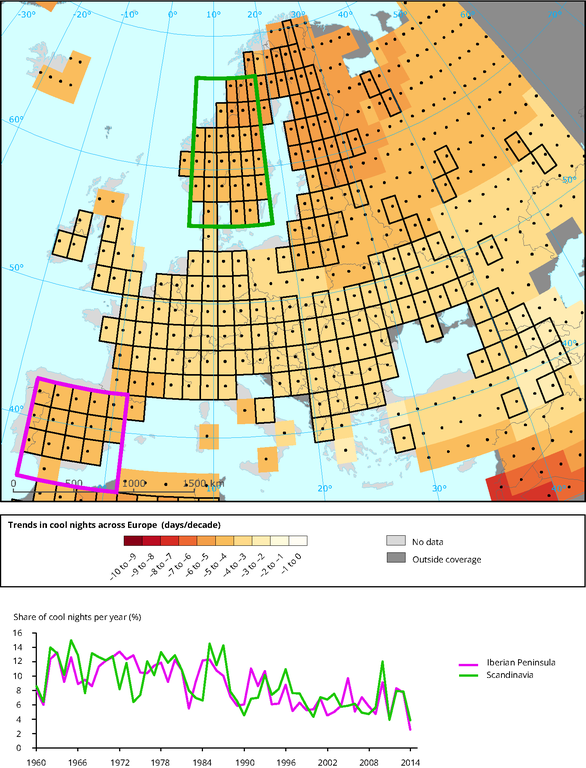
How to read the map:
Cool nights are defined as being below the 10th percentile of the daily minimum temperature. Grid boxes outlined in solid black contain at least 3 stations and so are likely to be more representative of the grid-box. Higher confidence in the long-term trend is shown by a black dot.
Loading