All official European Union website addresses are in the europa.eu domain.
See all EU institutions and bodies
An official website of the European Union | How do you know?
Environmental information systems
EN

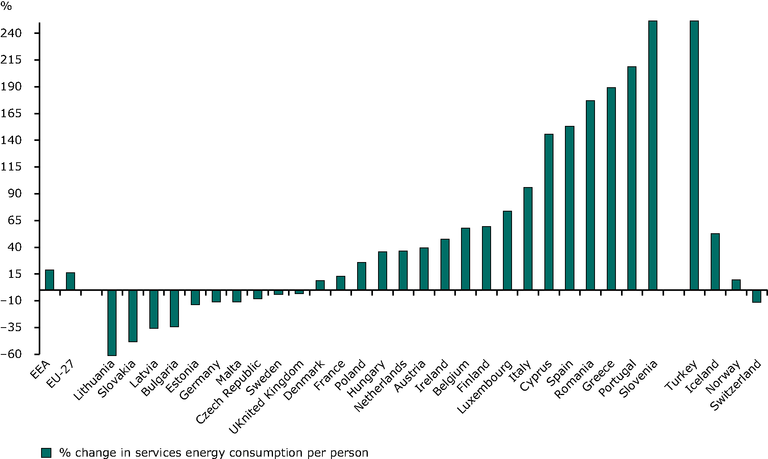
Based on the ratio : energy consumption / population (%/year calculated on the period 1990-2008)
Loading