All official European Union website addresses are in the europa.eu domain.
See all EU institutions and bodiesAn official website of the European Union | How do you know?
Environmental information systems
EN
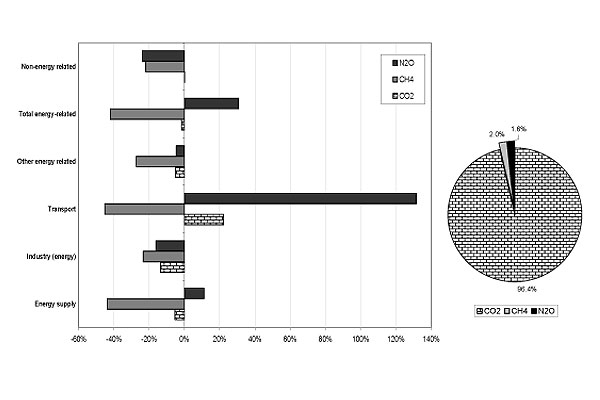
Greenhouse gas emissions have been calculated in equivalent tonnes of carbon dioxide using the following Global Warming Potential (GWP): 1 t CH4 = 21 t CO2-equivalent, 1 t N2O = 310 t CO2-equivalent
Loading