All official European Union website addresses are in the europa.eu domain.
See all EU institutions and bodiesAn official website of the European Union | How do you know?
Environmental information systems
EN
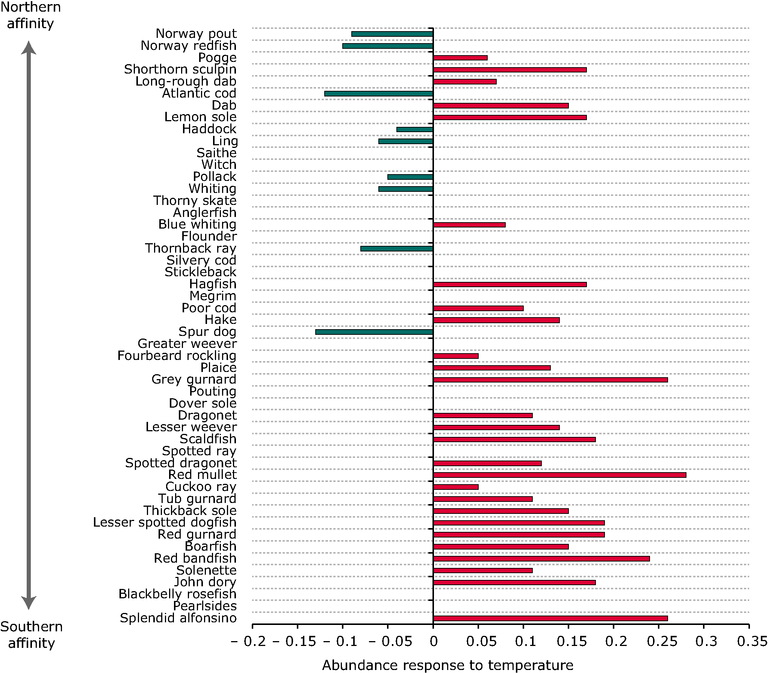
Changes in abundance in response to observed temperature change are relative changes (unitless).
Loading